Hotel Booking Reporting Pack
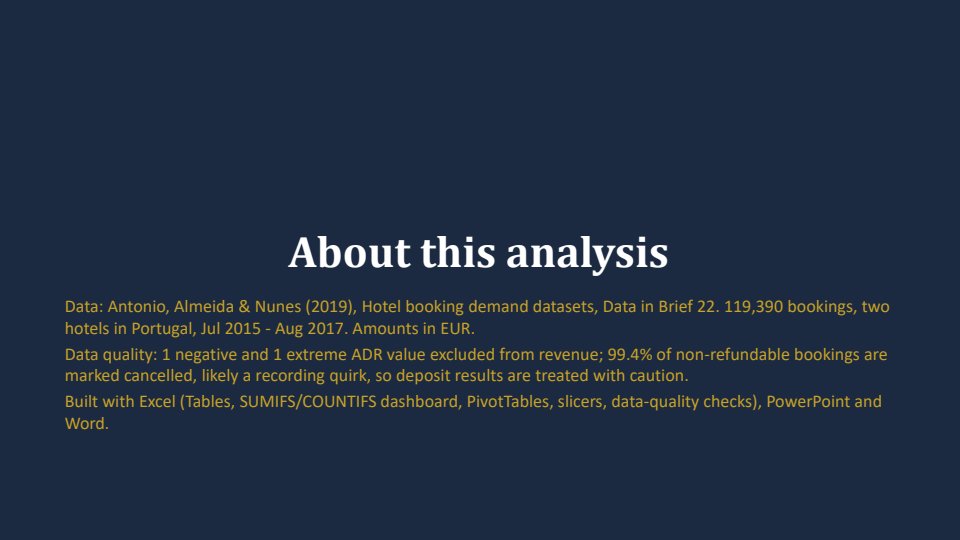
119,390 real hotel bookings turned into an Excel reporting workbook, an executive PowerPoint deck and a one-page Word brief. Built by Dhruv Rawat. Code and files on GitHub.
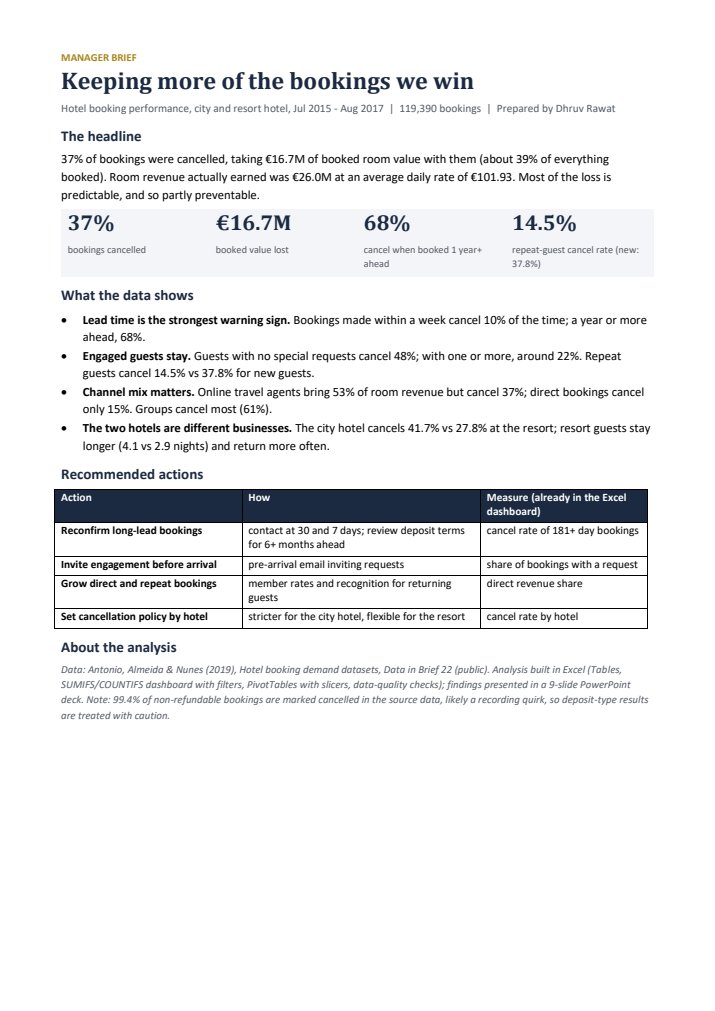
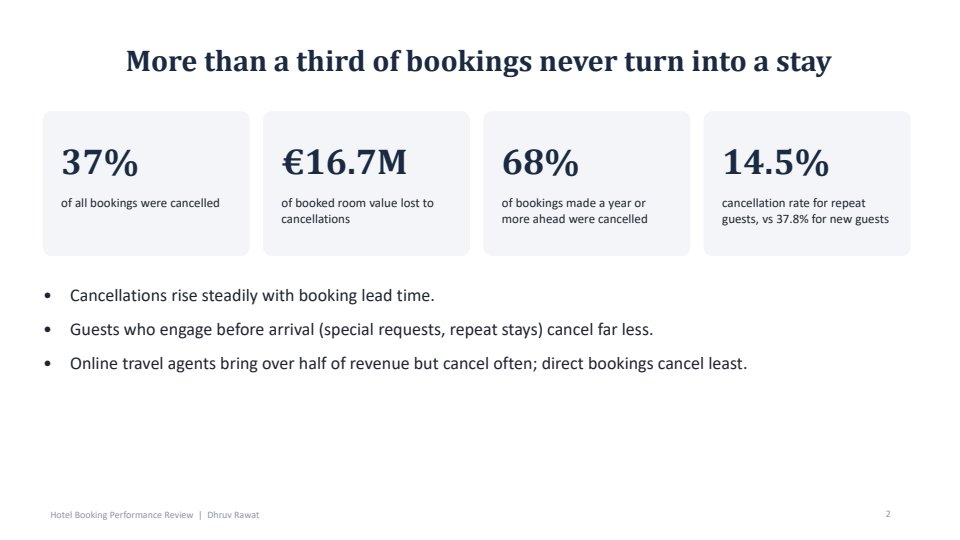
- 37% of bookings were cancelled, losing €16.7M of booked room value.
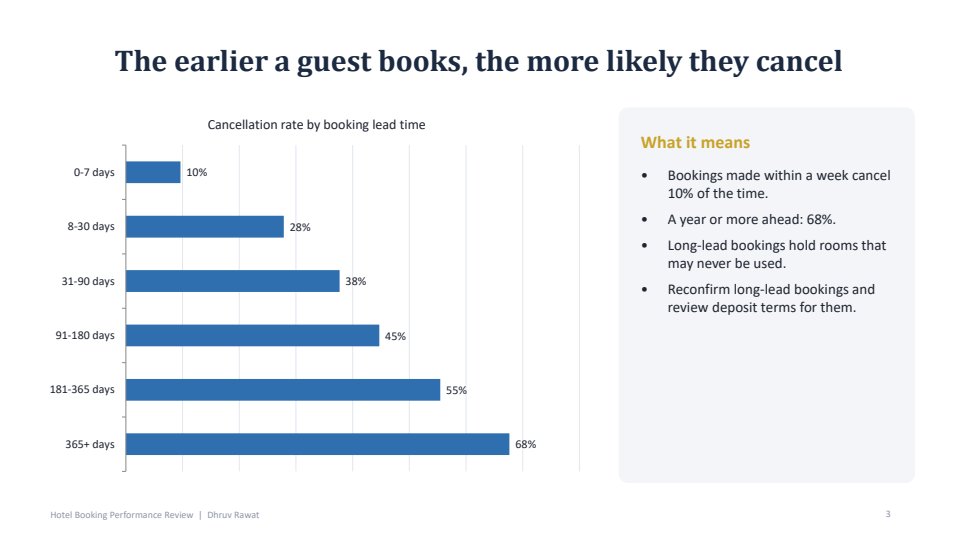
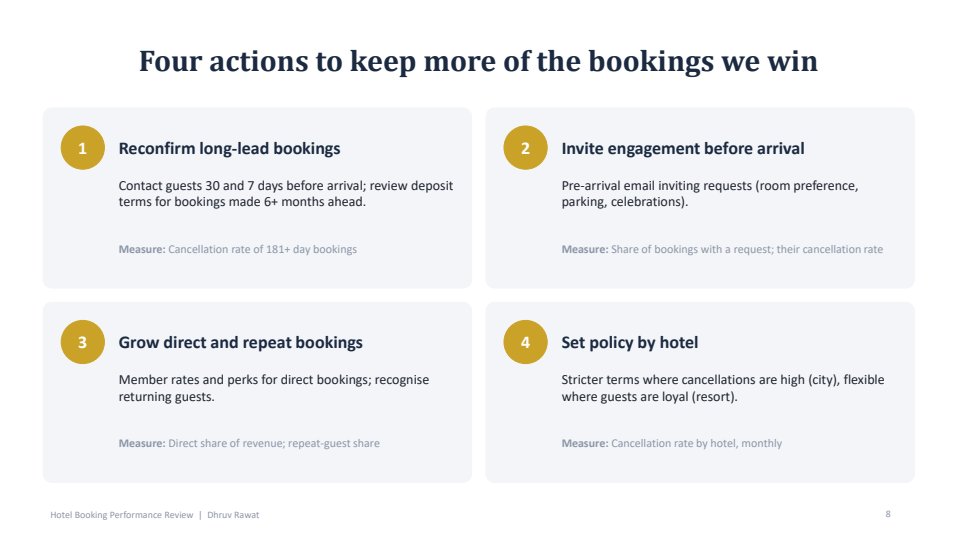
- The earlier a guest books, the more likely they cancel: 10% within a week vs 68% a year or more ahead.
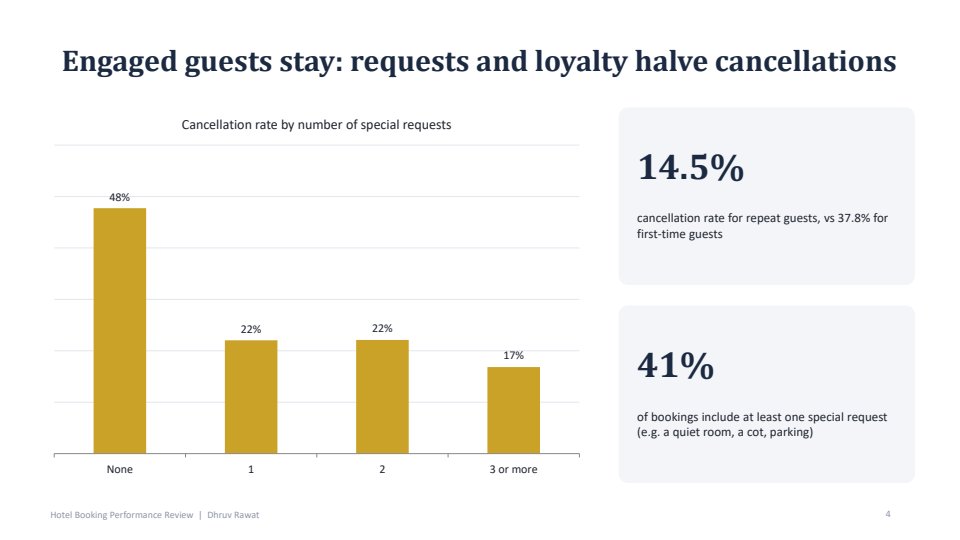
- Engaged guests stay: guests who make a special request cancel half as often (22% vs 48%).
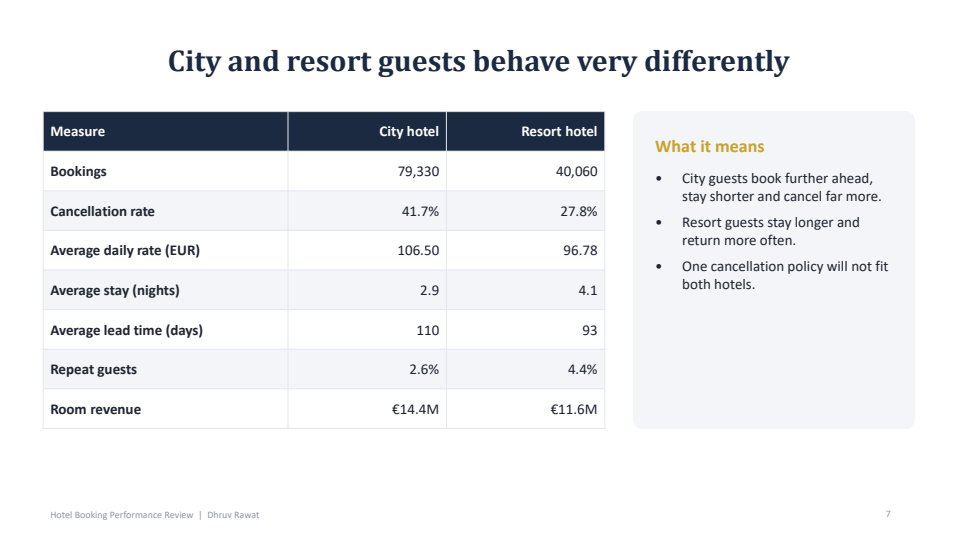
- Loyalty pays: repeat guests cancel 14.5% vs 37.8% for new guests.
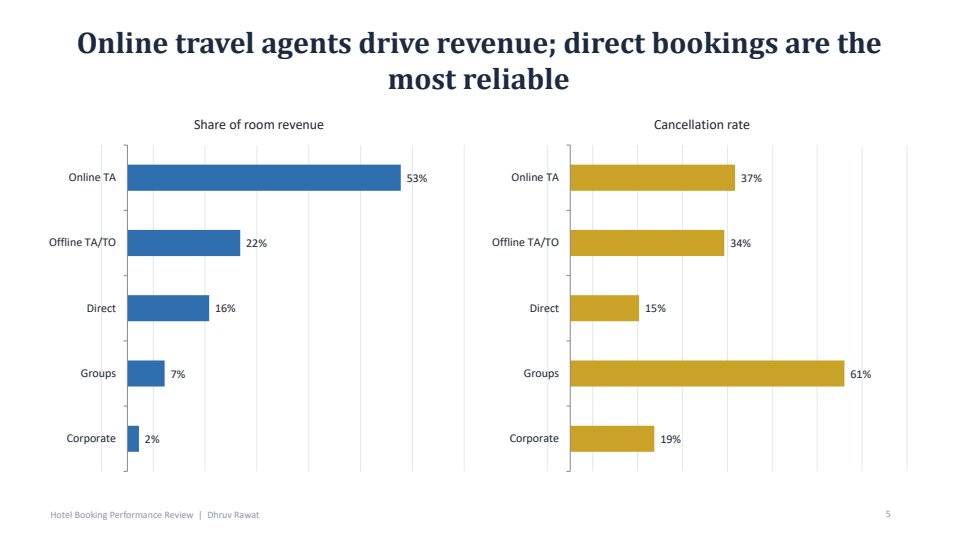
- Channel mix: online travel agents bring 53% of revenue; direct bookings cancel least (15%).
Excel workbookDashboard with filters, PivotTables, slicers, data-quality checks
PowerPoint deck9 slides, editable charts, speaker notes
Word brief (PDF)One page for managers
Excel: KPI dashboard
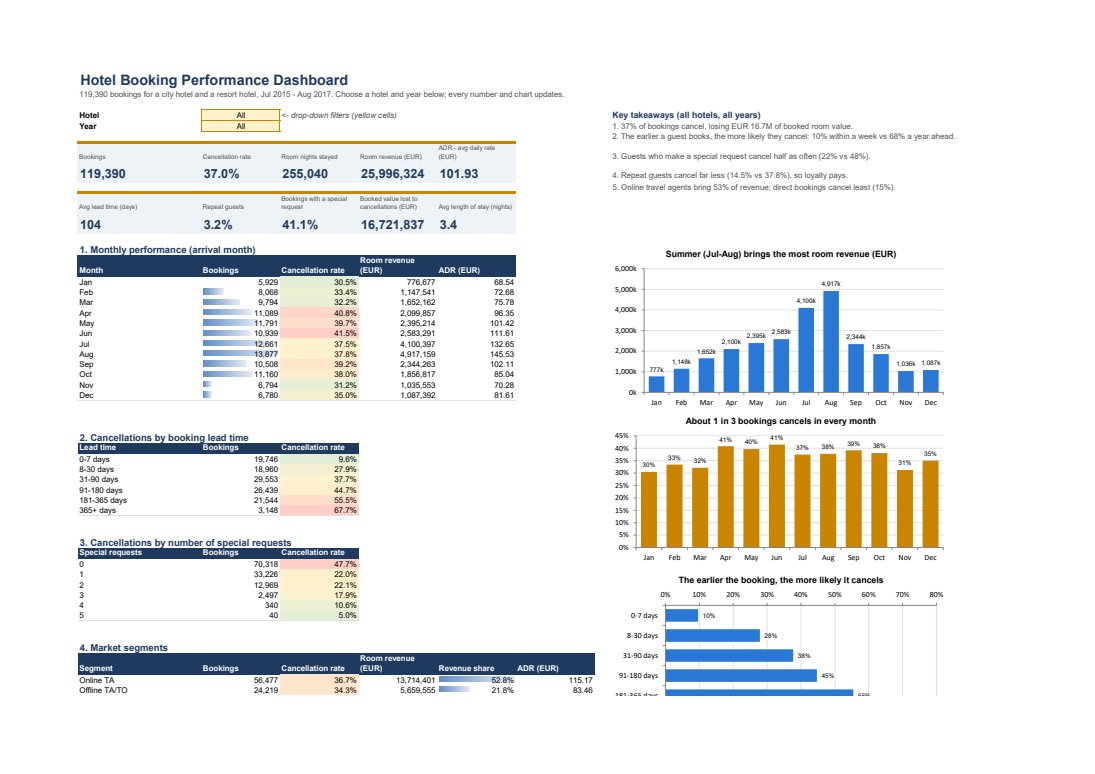
Every number is a live formula (COUNTIFS / SUMIFS / AVERAGEIFS) driven by the yellow Hotel and Year drop-downs.
Excel: PivotTables and slicers
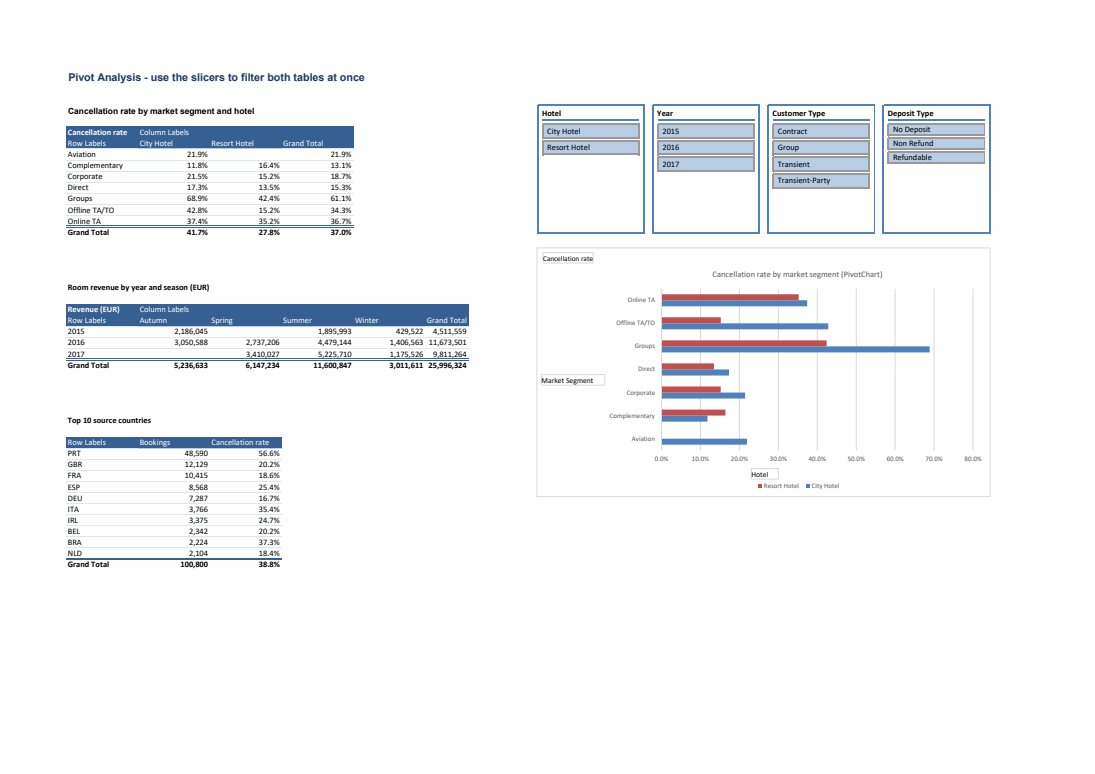
Three PivotTables connected to four slicers (hotel, year, customer type, deposit type), plus a PivotChart.
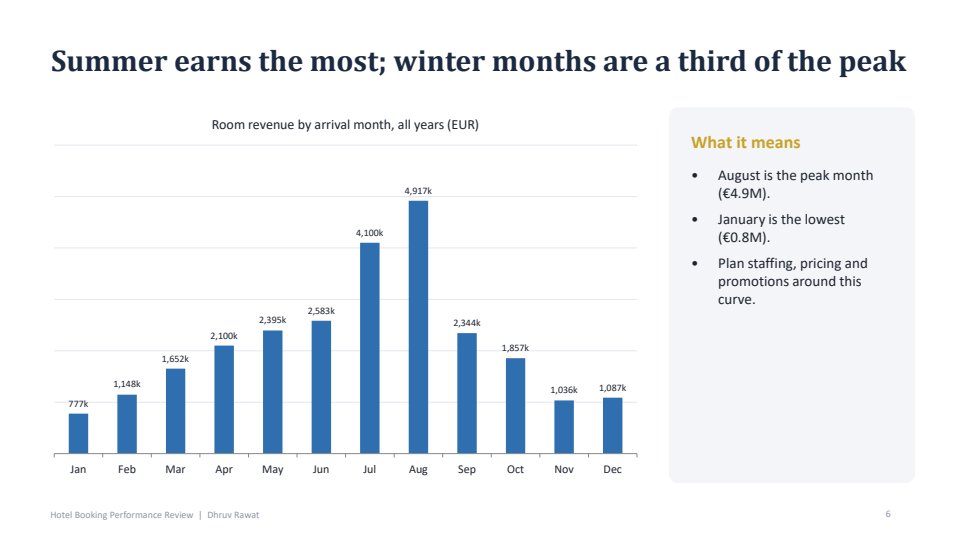
PowerPoint: executive deck
Word: one-page manager brief